Semiconductors have become a strategic input for digitalisation, artificial intelligence and industrial competitiveness. Global value creation is highly concentrated in the Americas and the Asia-Pacific region, while the European Union increasingly depends on imports, particularly from China. In response, the European Commission has proposed the European Tech Sovereignty Package, including the Chips Act 2.0. This article evaluates the initiative by analysing the global value chain, recent trade developments and the shortcomings of the Chips Act 1.0. Adopting a more comprehensive approach, the Chips Act 2.0 targets innovation, manufacturing and crisis preparedness across the entire value chain. However, persistent structural obstacles – fragmented markets, weak lead-market conditions, limited economies of scope, strong path dependencies and rising geoeconomic risks – limit its transformative potential. The article concludes that while the Chips Act 2.0 strengthens Europe’s position in the chips market, additional measures will be required to achieve strategic sovereignty.
The international political environment has become noticeably more challenging in recent years, with geopolitical tensions and disruptions to global trade routes highlighting the vulnerability of internationally integrated value chains. These developments underscore the growing strategic importance of semiconductors for the European economy. The automotive sector – one of Europe’s key industries – illustrates this particularly clearly: according to an analysis by the Joint Research Centre (Bonnet et al., 2025), the sector accounts for 37% of all chips shipped to the EU, with electric vehicles requiring more than 3,000 chips compared to up to 1,500 in conventional vehicles. At the same time, the rapid expansion of American and Chinese digital firms, especially in artificial intelligence, is reinforcing Europe’s dependence on external technological ecosystems. In response, the European Commission (2026a) presented the European Tech Sovereignty Package in June 2026, comprising four initiatives: the Chips Act 2.0, the Cloud and AI Development Act (CADA), a strategy for open digital ecosystems, and a Strategic Roadmap for Digitalisation and AI in the energy sector.
This article examines the Chips Act 2.0 (European Commission, 2026b). The first Chips Act (Regulation 2023/1781) was adopted only in the second half of 2023, at a time when the relevant supply-chain disruptions and the strategic importance of semiconductors were already well understood. This raises the question of why a second legislative initiative was required so soon thereafter, and which gaps in the initial regulation made further intervention necessary. To address this, the article first outlines the semiconductor value chain and the global market, including regional developments. It then analyses recent EU trade data to identify current patterns and dependencies. Building on these insights, the main provisions of the Chips Act 2.0 are described and the shortcomings of the first Chips Act are examined. This provides the foundation for the political-economic assessment presented in the conclusion. Throughout the article, the term “chips” is used as a simplified reference to microchips, semiconductors, integrated circuits and related components, further discussed below.
Chips value chain and the market for chips
The term “chips” simplifies a highly heterogeneous set of products, and the underlying value chain is equally complex. The following overview, based on Hillrichs and Wölfl (2025), OECD (2025), and Haramboure et al. (2023), is only a simplified representation of the chip market, which is highly globalised and shaped by companies that are deeply interconnected both internally and across borders. This article analyses the core value chain for chips, which consists of three main stages:
Design. According to Haramboure et al. (2023), Japan, South Korea and the United States are dominant at this stage, where the requirements for the chip are defined, its architecture is designed, and the design is validated on a test bench. This stage represents around 50% of value added, but only 10%-15% of capital expenditure.
Fabrication/foundry. China, Japan, South Korea and Taiwan are important players at this stage, where the previously designed integrated circuit is printed or etched onto the wafer (Haramboure et al., 2023). This occurs in so-called wafer fabrication facilities (fabs) and requires highly complex manufacturing processes involving specialised equipment and chemicals. This step represents around 25% of value added, but more than 60% of capital expenditure.
Assembly, test and packaging. China, Taiwan and Southeast Asia (Malaysia, Vietnam, the Philippines) hold strong positions in this segment (Haramboure et al., 2023), which represents around 5% of value added in the value chain, and 10%-15% of capital expenditure. This stage comprises wafers being cut into individual chips, packaged into frames or resin shells, and subsequently tested.
Upstream stages – for example, raw materials, intermediate goods, and manufacturing equipment – as well as downstream stages that cover the steps up to the final product are not addressed in this article. Nevertheless, it should be noted that the EU plays an important role in the value chain, particularly as a net exporter in the equipment segment (Bonnet et al., 2025, p. 5). However, for certain raw materials, the EU is almost entirely dependent on imports, for example from China.
To illustrate the scale and dynamics of the global chip market, Figure 1 presents regional data from the World Semiconductor Trade Statistics (WSTS, 2026a, 2026c). Global semiconductor sales increased from US $26 billion in 1986 to US $204 billion in 2000 and exceeded US $795 billion in 2025. For 2026, WSTS projects a market volume of roughly US $1.5 trillion (WSTS, 2026b), driven largely by rapid memory-chip expansion linked to substantial AI-related investments. Major US technology firms alone have announced AI investments of US $725 billion for 2026 (Tagesschau.de, 2026), a significant share of which is expected to flow into AI and memory chips for data-centre infrastructure.
Figure 1
Total semiconductor revenue by region
in US $ billion
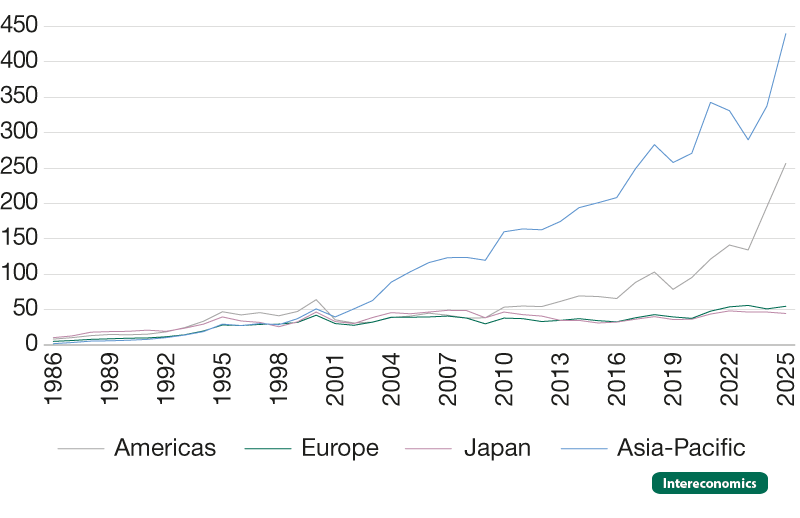
Source: World Semiconductor Trade Statistics (2026a); author’s depiction.
Figure 1 also illustrates that the rapid development of the chip market is occurring primarily in the Americas and in the Asia-Pacific region. In 2025, around 32% of global chip sales were generated in the Americas and roughly 55% in the Asia-Pacific region. Japan and Europe lag far behind, at a similar level of around 6%-7%. The growth rates likewise show the Americas and Asia-Pacific pulling further ahead. Between 2019 and 2025, market volume in the Americas grew by more than 220% and in the Asia-Pacific region by almost 93%. In Europe, growth over the same period amounted to more than 37%, and in Japan to more than 24%. The global chip market is expanding rapidly, but Europe is constantly falling behind. Against this backdrop, it is useful to examine the EU’s trade patterns to better understand current dependencies.
The development of the EU’s trade in chips
The following analysis of trade draws on data from Eurostat (2026). The trade statistics report trade flows according to Harmonised System (HS) codes for individual product categories and products. Following Röhl and Rusche (2022, 2024), the product categories with HS codes 8541 (semiconductor devices, e.g. diodes, transistors, LEDs, photovoltaic cells and mounted piezoelectric crystals) and 8542 (electronic integrated circuits and parts thereof) are used for the analysis. In contrast to Röhl and Rusche (2022, 2024), these categories are examined separately. The rationale is that this allows different stages of the value chain to be analysed. While HS 8541 includes essential intermediate goods for computer chips, thus approximating the second value-creation stage described in the chip value chain section, HS 8542 covers finished chips and therefore corresponds to stage three.
In addition, the analysis does not consider values in euros but instead the weight of the goods, as is done in Rusche (2026). This is to correct for price-based effects. If the value were used, the trade balance would indicate balanced trade relations if a small number of high-value chips were exported while a large number of low-value chips were imported, or vice versa, although dependencies might still prevail.
Based on Eurostat’s (2026) weight data for trade in semiconductor devices, Figure 2 shows developments since 1999. It shows that the EU maintained a largely balanced trade position until around 2016, with the exception of the period following the financial crisis. Since 2017, however, imports – particularly from China – have risen sharply, and as a consequence, the trade deficit in semiconductor devices has increased rapidly. Since 2022, the annual deficit has exceeded four million tonnes. Moreover, essentially 100% of extra-EU imports originate from China. When values in euros are considered, the deficit has been declining since 2022 (see Röhl & Rusche, 2024).
Figure 2
EU trade in semiconductor devices (left axis) and China’s share of extra-EU imports (right axis)
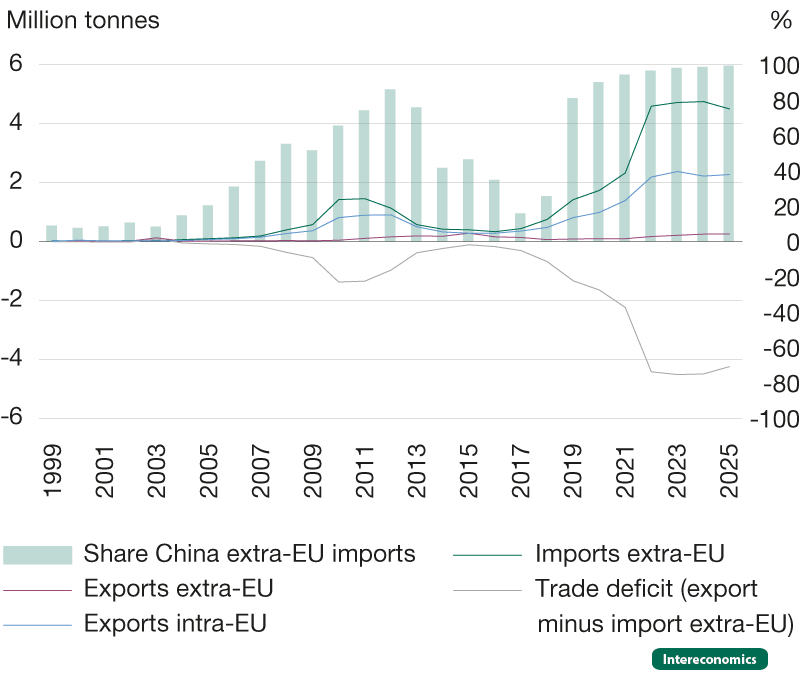
Notes: Semiconductor devices include, for example, diodes, transistors and semiconductor-based transducers. HS code 8541.
Source: Eurostat (2026); author’s depiction.
For HS 8542, a different pattern emerges (Figure 3). Measured by weight, the EU’s trade deficit in integrated circuits has declined steadily since 2019, falling from 34 kilotonnes to around 8.5 kilotonnes in 2025. As EU export volumes remain consistently low, this reduction is driven entirely by falling imports. China’s share of extra-EU imports has increased to nearly 30%, and more than half of the EU’s extra-EU trade deficit in integrated circuits is attributable to trade with China.
Figure 3
EU trade in electronic integrated circuits and parts thereof (left axis) and China’s share of extra-EU imports (right axis)
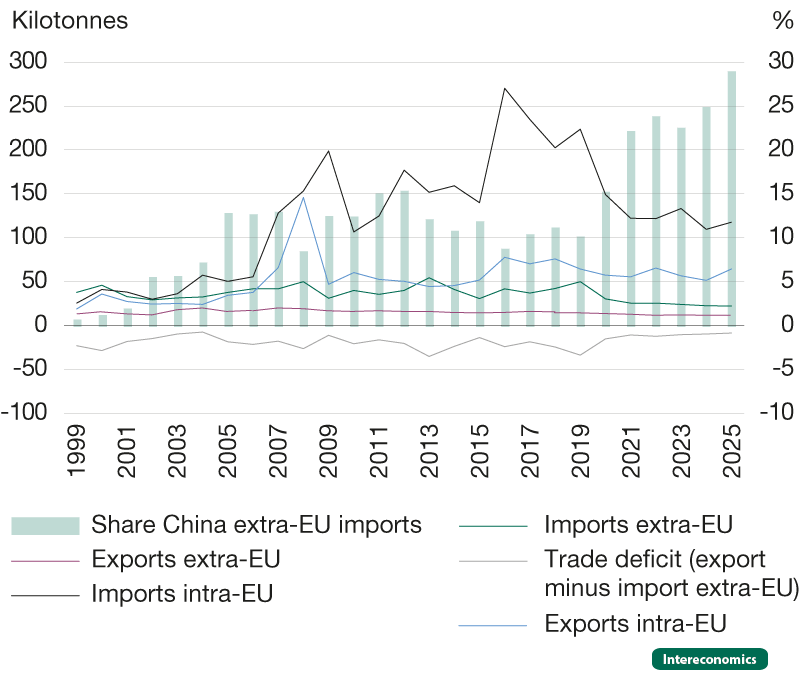
Notes: HS code 8542.
Source: Eurostat (2026); author’s depiction.
Intra-EU trade in integrated circuits exceeds extra-EU trade, yet Eurostat data reveal a persistent discrepancy between reported intra-EU imports and exports. Imports are systematically higher and more volatile, although – by definition – they should match. This phenomenon is not new and not limited to chips: The EU has recorded a long-standing “trade deficit with itself” (Kiel Institute for the World Economy, 2020), which may be linked to value-added tax fraud.
Overall, the EU remains heavily dependent on semiconductor imports, particularly from China, and China’s role in integrated-circuit trade continues to expand. Moreover, the rapid global growth of the semiconductor market is not reflected in EU trade dynamics, confirming the weak growth performance observed in WSTS (2026a) data. These structural dependencies and limited market dynamics form the backdrop for the analysis of the Chips Act 2.0 in the following section.
Chips Act 2.0 description and evaluation
Before discussing the Chips Act 2.0 in detail, it is useful to briefly recap the shortcomings of the first Chips Act (Regulation (EU) 2023/1781) from a policy perspective. Alongside the proposal for the Chips Act 2.0, the European Commission (2026c, 2026d) also published an impact assessment of the first Chips Act as well as an evaluation of policy options. In addition, the Draghi report (2024) also contains an analysis of the semiconductor market.
First, the Commission’s communication accompanying the Tech Sovereignty Package emphasises that “Europe risks falling further behind in the global tech race” (European Commission, 2026a, p. 29). This reflects the recognition that the EU’s semiconductor market is expanding far more slowly than those in the Americas and Asia-Pacific (Figure 1), and that additional action is required to prevent further divergence.
Second, the impact assessment highlights structural weaknesses in Europe’s capital markets (European Commission, 2026d). The absence of a genuine Capital Markets Union limits the availability of late-stage financing for start-ups and constrains large-scale investment by European firms. Although the EU performs strongly in science and early-stage innovation, restricted access to growth capital often forces innovative firms to relocate or be acquired by non-EU actors. In the chips sector, this dynamic is described as the “lab-to-fab-gap”. As a result, other regions ultimately benefit from innovations initially supported by European taxpayers. Draghi (2024, p. 68) similarly notes that European tech firms lack the scale needed to sustain long-term R&D. The first Chips Act did little to address this issue, as it focused primarily on supply-side measures (European Commission, 2026a).
Third, these scale limitations are closely linked to persistent fragmentation in the Single Market. The impact assessment stresses that a fully integrated Single Market has not yet been achieved, as national support schemes remain insufficiently coordinated (European Commission, 2026c, 2026d). This fragmentation weakens Europe’s capital-market performance and hampers the mobilisation of the very large investment volumes required for semiconductor projects – volumes that individual member states cannot shoulder alone. The European Commission (2026a) therefore seeks to strengthen coordination, communication and cooperation across the value chain.
Finally, supply-chain security remains a concern. The first Chips Act was drafted partly in response to the COVID-19 pandemic, the Ever Given blockage of the Suez Canal and disruptions linked to Russia’s war against Ukraine. As a result, crisis preparedness formed a central component of the regulation. However, the impact assessment shows that the EU still lacks sufficient insight into both European and global chips supply chains (European Commission, 2026d).
To address these shortcomings, the European Commission (2026b) proposed the Chips Act 2.0. According to the proposal, the regulation aims to enhance competitiveness and strengthen crisis preparedness. To this end, the Chips Act 2.0 is structured into three pillars: Pillar 1 focuses on innovation (set out in Chapter II: Chips for Europe Initiative 2.0), Pillar 2 on manufacturing (Chapter III: Security of supply and demand) and Pillar 3 on crisis response (Chapter IV: Monitoring and crisis response).
Pillar 1 – the Chips for Europe Initiative 2.0 – seeks to build large-scale technological capacities and promote research and innovation activities within the EU (Art. 4). Six operational objectives are defined:
- support for the development of advanced design capabilities
- promotion of new or existing pilot lines
- strengthening of advanced technology and engineering capacities
- establishment and networking of competence centres
- development and reinforcement of advanced design prototyping, and industrial deployment capacities for photonic integrated circuit technologies and other photonic technologies
- facilitating access to finance through a dedicated “Chips Fund”.
Pillar 2 focuses on securing supply and demand. This is achieved by supporting domestic production and by promoting investment in response to sufficient demand for the products concerned, for example through public procurement. Domestic production is strengthened through public support schemes (Art. 12(2)), the coordination of financing – such as by the Commission (Art. 20) – and the reduction of administrative burdens by introducing one-stop shops (Art. 22) and a single access portal (Art. 24). This chapter also outlines the European Semiconductor Regions of Excellence label (Art. 26), which is awarded by the European Commission. However, such label policies assist investors but do not resolve structural bottlenecks. Positive effects can arise only through enhanced networking.
Pillar 3 sets out the crisis-response mechanism. It first includes a strategic mapping of the Union’s semiconductor sector carried out by the European Commission in cooperation with the European Semiconductor Board (Art. 33). Together with the Board, the Commission develops early-warning indicators. The European Semiconductor Board consists of one representative from each member state and is chaired by a representative of the European Commission (Art. 44).
Furthermore, a B2B platform is established (Art. 34) through which companies can provide data to enable the creation of a digital twin of the chips sector and its value chains. If disruptions occur that lead to shortages and affect critical sectors, the crisis stage can be activated by the Council (Art. 39). Three instruments can then be used in response: first, information on the crisis, its impacts, and related developments is collected (Art. 41); second, priority-rated orders may be introduced (Art. 42); third, joint purchasing can be undertaken (Art. 43). The latter two instruments apply only to critical sectors.
Conclusion
The analysis presented in this article shows that the Chips Act 2.0 constitutes a meaningful step forward compared to its predecessor. By broadening the scope from supply-side interventions to a more comprehensive value-chain approach – including research, design, manufacturing, testing and demand creation – the regulation addresses several structural weaknesses that limited the effectiveness of the Chips Act 1.0. The initiative also reflects a more realistic assessment of Europe’s position in the global chip landscape, where dynamic growth in the Americas and Asia-Pacific continues to widen the gap.
However, the transformative potential of the Chips Act 2.0 remains constrained by persistent structural obstacles. Fragmentation in the Single Market continues to hinder the scaling of production capacities and the efficient allocation of public support. Europe lacks strong lead markets capable of generating the demand intensity required for large-scale investment and rapid learning effects. Existing economies of scope in Asia and North America reinforce path dependencies that draw talent, capital and firms toward established clusters. In addition, rising geoeconomic tensions may complicate Europe’s access to critical inputs, equipment and specialised labour.
Against this backdrop, the Chips Act 2.0 can stabilise and strengthen Europe’s chip ecosystem, but it is unlikely to close the competitiveness gap on its own. Achieving genuine strategic sovereignty will require deeper capital-market integration, more closely coordinated industrial policies across member states, stronger demand-side instruments, and sustained investment in talent and infrastructure. Without these complementary measures, Europe risks remaining structurally dependent on external chip ecosystems despite regulatory advances.
References
Bonnet, P., Ciani, A., Molnar, J., & Nardo, M. (2025). EU’s strengths and weaknesses in the global semiconductor sector. Joint Research Centre, JRC141323.
Carrara, S., Bobba, S., Blagoeva, D., Alves Dias, P., Cavalli, A., Georgitzikis, K., Grohol, M., Itul, A., Kuzov, T., Latunussa, C., Lyons, L., Malano, G., Maury, T., Prior Arce, A., Somers, J., Telsnig, T., Veeh, C., Wittmer, D., Black, C., Pennington, D., & Christou, M. (2023). Supply chain analysis and material demand forecast in strategic technologies and sectors in the EU – A foresight study. Publications Office of the European Union.
Di Girolamo, F., & Kotsev, A. (2026). From dependency to resilience. Joint Research Centre (JRC), JRC147104.
Draghi, M. (2024). The future of European competitiveness – A competitiveness strategy for Europe, Part B – In-depth analysis and recommendations. European Commission.
European Commission. (2026a). Communication on European Tech Sovereignty, accompanied by an EU Open Source Strategy (COM(2026) 503 final).
European Commission. (2026b). Proposal for a Regulation of the European Parliament and of the Council on a framework of measures for strengthening the Union’s semiconductor ecosystem, repealing Regulation (EU) 2023/1781 (Chips Act 2.0) (2026/0139 (COD)).
European Commission. (2026c). Executive summary of the impact assessment report accompanying the document Proposal for the Chips Act 2.0 (SWD(2026) 505 final).
European Commission. (2026d). Impact assessment report (SWD(2026) 504 final, Part 3/3).
Eurostat. (2026). EU trade since 1988 by HS2 4-6 and CN8 [ds-045409] [Database].
Haramboure, A., Lalanne, G., Schwellnus, C., & Guilhoto, J. (2023). Vulnerabilities in the semiconductor supply chain. OECD Science, Technology and Industry Working Papers, No. 2023/05. OECD Publishing.
Hillrichs, D., & Wölfl, A. (2025). Complexities and dependencies in the global semiconductor value chain. EconPol Policy Report, 54. Ifo-Institut.
Kiel Institute for the World Economy. (2020, 7 January). The EU Runs a Large Trade Surplus with Itself—One Reason Is Apparently Large-Scale VAT Fraud.
OECD. (2025). Mapping the semiconductor value chain. OECD Science, Technology and Industry Policy Papers, No. 182.
Röhl, K.-H., & Rusche, C. (2022). Der EU Chips-Act. Eine Chance für Halbleiter aus Europa? IW Kurzbericht, No. 7.
Röhl, K.-H., & Rusche, C. (2024). Wo steht die EU im globalen Chip-Wettrennen? IW-Kurzbericht, No. 45.
Rusche, C. (2026). Wie abhängig sind Deutschland und die EU von Chipimporten? Wirtschaftsdienst, 106(1), 67–70.
Tagesschau.de. (2026). KI-Investitionen steigen auf 725 Milliarden Dollar.
World Semiconductor Trade Statistics. (2026a). WSTS historical billings report.
WSTS. (2026b). Global semiconductor market surges beyond $1.5T 2026.
WSTS. (2026c). Introduction to WSTS.